Improving Global Tech Resource Management: Mapping & Bridging Cultural Gaps

Improving Global Tech Resource Management: Mapping & Bridging Cultural Gaps
ABSTRACT
India is the world’s largest democracy and the fifth largest economy, coming in at an estimated four trillion dollars in 2010 (Central Intelligence Agency, 2011). The U.S.A.’s economy is the world’s largest, coming in at an estimated twelve trillion dollars in 2010 (Central Intelligence Agency, 2011). What happens when two of the world’s economic powerhouses come together to do business? The commonalities in democratic governments and the use of English in official matters can make doing business transactions across borders easy between India and the U.S.A. At the same time, cultural differences should not be ignored.
This paper seeks to explore the impact of cultural differences between the U.S.A. and India in the particular area of work culture and how to apply the Map-Bridge-Integrate process. Using Hofstede’s typology, a comparison is made on the overall cultural differences between the U.S.A. and India. The mapping techniques have been shown in order to show the difference in terms of technology adoption. Then a comparative analysis is performed on the work culture literature in both countries revealing some distinct differences that help to bridge the communication gap. The integration of India’s culture with the U.S.A. is in their all-encompassing approach to work accountability.
INTRODUCTION
As globalization gathers momentum, contact between business people from other countries is becoming more frequent. The more national boundaries a company crosses, the greater the scope for misunderstanding and conflict. To succeed internationally, it is essential to be able to break the barriers of culture, language, and set patterns of thinking.
A decade ago, the work culture in India had vast differences as compared to the rest of the world, especially western countries. But, now there is a paradigm shift due to the enormous growth of MNCs in the IT sector in India, BPOs, etc. The advent of globalization made business enterprises and employees work across the borders of various countries, thus providing exposure to cross-cultural working environments to both the organizations and employees. This eliminated the huge gap between the work culture of India and other countries to some extent. However, in fields other than IT and Government sectors of India the work culture differs a lot from that of other countries.
A good work environment addresses the culture of the group and the humanity of the individual. It also acknowledges that some habitat needs are universal.
MANAGING CULTURAL DIFFERENCES
MAP (UNDERSTAND THE DIFFERENCES)
Cultural values
Leadership style
Personality
Thinking style
INTEGRATE (MANAGE THE DIFFERENCES)
Managing participation
Resolving conflicts
Building on ideas
BRIDGE (COMMUNICATE ACROSS DIFFERENCES)
Approaching with motivation & confidence
Decentering w/o Blame.
Reentering with Commonalities
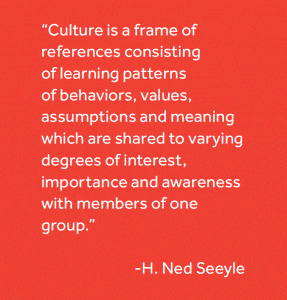
Mapping, Bridging, Integrating: Measurable increases in productivity and effectiveness can be gained by not only effectively managing differences in cultures among employees, but by leveraging the differences to provide added value.
MAPPING CULTURAL GAPS
DIMENSIONS OF NATIONAL CULTURES
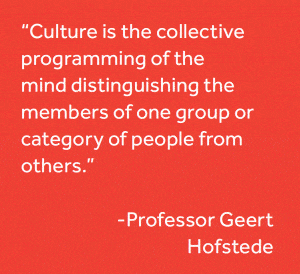
Geert Hofstede has operated in an international environment since 1965, and his curiosity as a social psychologist led him to the comparison of nations, first as a traveling international staff member of a multinational (IBM) and later as a visiting professor at an international business school in Switzerland. His 1980 book Culture’s Consequences combined his personal experiences with the statistical analysis of two unique databases.
FIVE DIMENSIONS OF CULTURE
The first and largest comprised answers from matched employee samples from 40 different countries to the same attitude survey questions. The second consisted of answers to some of these same questions by his executive students who came from 15 countries and from a variety of companies and industries. Systematic differences between nations in these two databases occurred in particular for questions dealing with values. Values, in this case, are “broad preferences for one state of affairs over others”, and they are mostly unconscious.
In order to gauge the impact of differences in national culture on management, G. Hofstede carried out a cross-cultural study in 50 countries and 3 regions. Since modern cultures are too complex and subculturally heterogeneous, the strategy used in the original research was a narrow-sample strategy based on a comparison of similar subcultures in different countries.
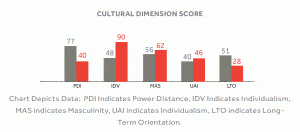
The values that distinguished countries (rather than individuals) from each other grouped themselves statistically into four clusters. They dealt with four anthropological problem areas that different national societies handle differently: ways of coping with inequality, ways of coping with uncertainty, the relationship of the individual with her or his primary group, and the emotional implications of having been born as a girl or as a boy.
These became the Hofstede dimensions of national culture: Power Distance, Uncertainty Avoidance, Individualism versus Collectivism, and Masculinity versus Femininity. Between 1990 and 2002, these dimensions were largely replicated in six other cross-national studies on very different populations from consumers to airline pilots, covering between 14 and 28 countries.
HOFSTEDE’S DIMENSION TRAITS
- Power distance
- Individualism vs. collectivism
- Femininity vs. masculinity
- Uncertainty avoidance
- Long term orientation
POWER DISTANCE (PDI)
This dimension deals with the fact that all individuals in societies are not equal – it expresses the attitude of the culture toward these inequalities among us. Power distance is defined as the extent to which the less powerful members of institutions and organizations within a country expect and accept that power is distributed unequally. It has to do with the fact that a society’s inequality is endorsed by the followers as well as by the leaders.
The U.S.A. score low on this dimension, (40), which underscores:
- The American premise of “liberty and justice for all”.
- This is also evidenced by the focus on equal rights in all aspects of American society and government.
- Within American organizations, hierarchy is established for convenience, superiors are always accessible and managers rely on individual employees and teams for their expertise.
- Both managers and employees expect to be consulted and information is shared frequently.
- At the same time, communication is informal, direct, and participative.
India scores high on this dimension, (77), indicating:
- An appreciation for hierarchy and a Top – Down Structure in society and Organizations.
- If one were to encapsulate the Indian attitude, one could use the following words and phrases:
- Dependent on the boss or the power holder for direction.
- Acceptance of unequal rights between the power-privileged.
- Real Power is centralized even though it may not appear to be & managers count on the obedience of their team members.
- Employees expect to be directed clearly as to their functions and what is expected of them.
- Control is familiar, even psychological security, and attitude towards managers are formal even if one is on a first-name basis.
- Communication is top-down and directive in its style & often feedback, which is negative, is never offered up the ladder.
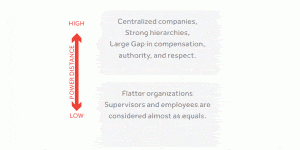
IMPACT ON MANAGEMENT:
- Type of management structure
- Decision process
- Flow of information
- Inequalities/equalities
INDIVIDUALISM / COLLECTIVISM
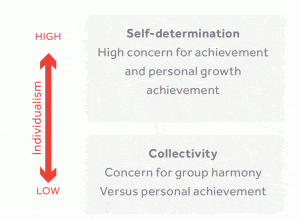
The fundamental issue addressed by this dimension is the degree of interdependence a society maintains among its members. It has to do with whether people´s self-image is defined in terms of “I” or “We”. In Individualist societies people are supposed to look after themselves and their direct families only. In Collectivist societies, people belong to ‘in groups’ that take care of them in exchange for loyalty.
- The United States of America, with a score of 91 on this dimension, is a highly individualistic culture. This translates into:
- A loosely knit society in which the expectation is that people look after themselves and their immediate families.
- A high degree of geographical mobility in the United States and most Americans are accustomed to doing business with, or interacting, with strangers.
- Americans are not shy about approaching their prospective counterparts in order to obtain or seek information.
- In the business world, employees are expected to be self-reliant and display initiative.
- Also, within the exchange-based world of work, hiring and promotion decisions are based on merit or evidence of what one has done or can do.
India, with a score of 48 is a society with clear collectivistic traits. This means that: - There is a high preference for belonging to a larger social framework in which individuals are expected to act in accordance with the greater good of one’s defined in-group(s).
- The actions of the individual are influenced by various concepts such as the opinion of one’s family, extended family, neighbors, workgroup, and other such wider social networks that one has some affiliation toward.
- The employer/employee relationship is one of the expectations based on expectations – of loyalty by the employee and almost familial protection by the employer.
- Hiring and promotion decisions are often made based on relationships, which are the key to everything in a collectivist society.
IMPACT ON MANAGEMENT:
- Employee/employer relations
- Decision making
- Conflict management
FEMININITY/MASCULINITY (MAS)
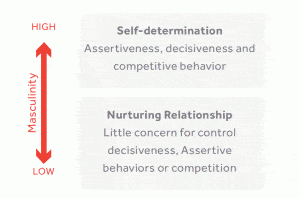
A high score (masculine) on this dimension indicates that society will be driven by competition, achievement, and success, with success being defined by the “winner” or “best in the field”. This value system starts in school and continues throughout one’s life – both in work and leisure pursuits.
A low score (feminine) on the dimension means that the dominant values in society are caring for others and quality of life. A feminine society is one where the quality of life is the sign of success and standing out from the crowd is not admirable. The fundamental issue here is what motivates people, wanting to be the best (masculine) or liking what you do (feminine).
The U.S.A. scores 62 on this dimension and is considered a “masculine” society.
- Behavior in school, work, and play is based on the shared values that people should “strive to be the best they can be” and that “the winner takes all”.
- Americans will tend to display and talk freely about their “successes” and achievements in life, here again, another basis for hiring and promotion decisions in the workplace.
- Americans “live to work” so that they can earn monetary rewards and attain higher status based on how good they can be.
- Conflicts are resolved at the individual level and the goal is to win.
India scores 56 on this dimension and is thus considered a masculine society. Even though it is mildly above the mid-range in the score.
- India is actually very masculine in terms of visual display of success and power.
- The designer brand label, the flash, and the bling that goes with advertising one’s success are widely practiced.
- This often reigns in people from indulging in Masculine displays to the extent that they might be naturally inclined to.
- In more masculine countries the focus is on success and achievements, validated by material gains.
- Work is the center of one’s life and visible symbols of success in the workplace are very important.
IMPACT ON MANAGEMENT:
Masculine societies will value
- Competition, speed, strength, and wealth
- Promotion
- Emphasis on individual responsibility
- Open & hard conflicts
UNCERTAINTY AVOIDANCE (UAI)
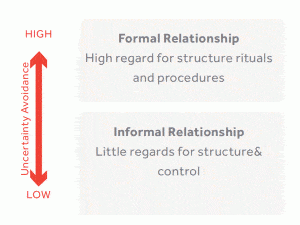
The dimension of Uncertainty Avoidance has to do with the way that a society deals with the fact that the future can never be known: should we try to control the future or just let it happen? This ambiguity brings with it anxiety and different cultures have learned to deal with this anxiety in different ways. The extent to which the members of a culture feel threatened by ambiguous or unknown situations and have created beliefs and institutions that try to avoid these is reflected in the UAI score.
The U.S.A. scores 46 on this dimension and therefore,
- American society is what one would describe as “uncertainty-accepting”.
- There is a larger degree of acceptance of new ideas, innovative products, and a willingness to try something new or different, whether it pertains to technology, business practices, or foodstuffs.
- Americans tend to be more tolerant of ideas or opinions from anyone and allow freedom of expression.
- At the same time, Americans do not require a lot of rules and are less emotionally expressive than higher-scoring cultures.
India scores 40 on this dimension and thus has a medium-low preference for avoiding uncertainty.
- In India there is acceptance of imperfection; nothing has to be perfect nor has to go exactly as planned.
- India is traditionally a patient country where tolerance for the unexpected is high, even welcomed as a break from monotony.
- A word used often is “adjust” and means a wide range of things, from turning a blind eye to rules being flouted to finding a unique and inventive solution to a seemingly insurmountable problem.
- It is this attitude that is both the cause of misery as well as the most empowering aspect of the country.
- There is a saying that “nothing is impossible” in India, so long as one knows how to “adjust”.
LONG-TERM ORIENTATION (LTO)
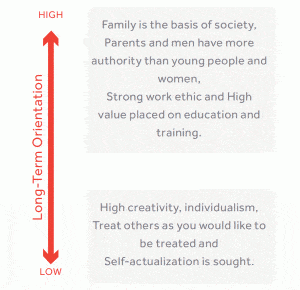
The long-term orientation dimension is closely related to the teachings of Confucius and can be interpreted as dealing with society’s search for virtue, the extent to which a society shows a pragmatic future-oriented perspective rather than a conventional historical short-term point of view.
The United States scores 29 on this dimension and is a short-term-oriented culture. As a result:
- It is a culture focused on traditions and fulfilling social obligations.
- American businesses measure their performance on a short-term basis, with profit and loss statements being issued on a quarterly basis.
- This also drives individuals to strive for quick results within the workplace.
- There is also a need to have the “absolute truth” in all matters.
The Indians scored 61, making it a long-term, pragmatic culture. In India, the concept of “karma” dominates religious and philosophical thought. Time is not linear, and thus not as important as to western societies, which typically score low on this dimension. Societies that have a high score on Long Term Orientation:
- Forgive the lack of punctuality.
- A changing game plan based on changing reality.
- General comfort with discovering the fated path as one goes along rather than playing to an exact plan.
DIMENSIONS SCORES ARE RELATIVE
The country scores on these dimensions are relative – societies are compared to other societies. These relative scores have been proven to be quite stable over decades. The forces that cause cultures to shift tend to be global or continent-wide – they affect many countries at the same time so if their cultures shift, they shift together, and their relative positions remain the same.
TECHNOLOGY ADOPTIONS IN INDIA VS. U.S.A.
The contribution of new technology to economic growth can only be realized when and if the new technology is widely diffused and used. Diffusion itself results from a series of individual decisions to begin using the new technology, decisions which are often the result of a comparison of the uncertain benefits of the new invention with the uncertain costs of adopting it. As the utilization and commercialization of technology become more widespread throughout the world, the adoption of novel technology can generate new business opportunities and various benefits. Nowadays, both large organizations, small, and medium-sized enterprises (SMEs) are seeking ways to reinforce their competitive position and improve their productivity.
Accordingly, there is an increasing consciousness of the necessity to derive profit through investment in technology within organizations. Technology tools can significantly assist organizations by supplying the required infrastructure, which is necessary for providing appropriate types of information at the right time. Technology can also provide organizations with competitiveness through integration between supply chain partners and inter-organizational functions, as well as by providing critical information.
The U.S.A. is the fastest-growing nation in IT technology. Things are moving fast. But India is slow in terms of technology adoption. The research shows that in the United States of America: 19% of people are eager to adopt new technology while 9-10% (approx.) are willing to adopt new technology in India. This major gap in technology adoption hinders the relationship in Onsite-Offshore Model and results in:
- The inappropriate connection between adopted IT and enterprise strategies.
- Inadequate realization of organizational issues.
- Inadequate realization of end-user necessities.
- Lack of manager and employee involvement in different stages of IT adoption.
- Lack of required resources (knowledge, skills, finance, management).
- Inadequate teaching and preparation of end users.
- Inappropriate assistance role and supportive regulation.
- Dissatisfaction with IT-created competitive advantages due to improper interactions with competitors and customers.
It is believed that the technology adoption issues and related factors can be reduced through a developed, integrated framework and suggested model of the effective technology adoption process, which can help organizations, managers, and IT consultants to achieve smooth working in Onsite-Offshore Model.
About The Data: The data is based on 12,000 online interviews conducted in September 2012 across 24 countries, with adults aged 18-64. The US data is based on a sample size of 500.
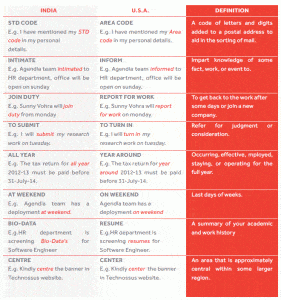
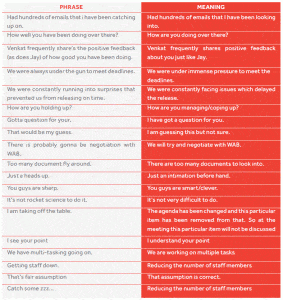
EXAMPLE CULTURAL EXPRESSION VARIANCES USA V. INDIA
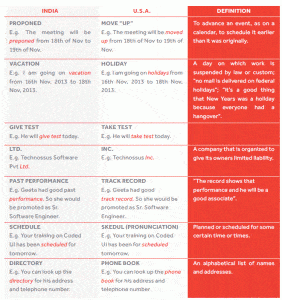
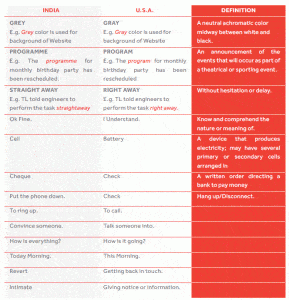
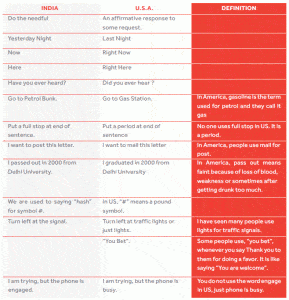 BUSINESS MEETING ETIQUETTE INDIA VS. U.S.A.

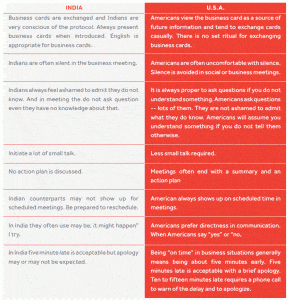

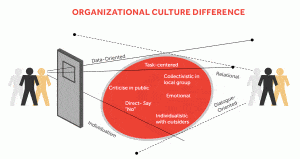


INTEGRATING CULTURAL GAPS
Integrating is the last step in getting high performance from the cultural gap. The skills needed here are much the same as they are in any team situation, but they lead to better quality decisions and implementation when they are built on strong mapping and bridging. The three integrating skills are:
Managing Participation
It is impossible to build high-quality solutions unless you have everyone’s input – to start with. The key here is to engage in different modes of participation across a decision-making task in:
- Small groups
- Large groups
- One-to-one
- Writing or pictures
- Spoken dialogue
- Both in-person and electronically
This way people can provide their best input in a comfortable manner and respond to others on their own terms. The leader should play an active role in balancing the different modes, ensuring that everyone is contributing and responding.
Resolving Conflicts
When two people or a group are reaching for synergy, they will face significant disagreement: “Okay, I understand your perspective, but I still don’t agree”. One often-forgotten step is detecting disagreement in the first place. Different people and cultures express conflict differently and these signals are often misread.
The parties should make extra efforts to deal with the conflict in appropriate ways – as relevant disagreement among people who respect and understand each other, and not as a battle for right and wrong.
- Mapping the different perspectives provides an objective picture of how far apart the parties are, lowering defenses and setting the stage to develop ideas for how to create new solutions.
- Bridging brings positive attitudes and behaviors that create win-win solutions.
And if participation is managed well, all parties will contribute to the solution and are likely to buy into it and implement it well.
Building on Ideas
To build on ideas, use all the techniques you’ve experienced, heard about, and read about, including brainstorming and creative exercises. Thus,
- Focus on exploring differences rather than similarities.
- Building on each other’s ideas.
- Trying to invent new ideas.
- Using conflict resolution skills, do more than combine and compromise.
- Find new solutions that excite everyone.
CONCLUSION
The Map-Bridge-Integrate Process uses an objective assessment of differences and similarities as input for an ongoing dialogue. Mapping, bridging, and integrating must work together. Performance comes from integrating, but integrating can not happen without bridging.
In fact, according to the research, good bridging almost always leads to good integration. If you get bridging right, you’ll almost always certainly get integrating and the accompanying performance. Bridging, in turn, rests on good mapping. Maps provide the objective input for building bridges; both attitudes and skills. The MBI process can not be put in place with policies. It is a set of skills that must be practiced and learned over time. The good news is that even a little bit of MBI brings an improvement in performance and people tend to see quick results in the interactions. In today’s economic environment, every leader needs to accomplish more with the human resources they have. Map-bridge-integrate is a good set of best practices to achieve that goal.
ABOUT TECHNOSSUS
Technossus is a Software Solutions and Technology Consulting company. At Technossus we believe, the key to delivering value is our ability to help analyze and address our customers’ business needs, to maximize their performance, and work with them to achieve their vision. We design, develop and implement innovative software solutions to improve our clients’ productivity and efficiency thereby ensuring ROI and enabling their success. Our strategy is to use our expertise in technology, consulting, and smart sourcing to help clients operate within their budgets and achieve high performance so they can create sustainable value for their customers and stakeholders.
© 2022 Technossus LLC, Irvine USA. All Rights Reserved. Technossus believes the information in this document is accurate as of its publication date; such information is subject to change without notice.
info@technossus
www.technossus.com
Tel: 949.878.3997 / Fax: 866.878.3918
17885 Von Karman Ave Suite 210 Irvine, CA 92614
